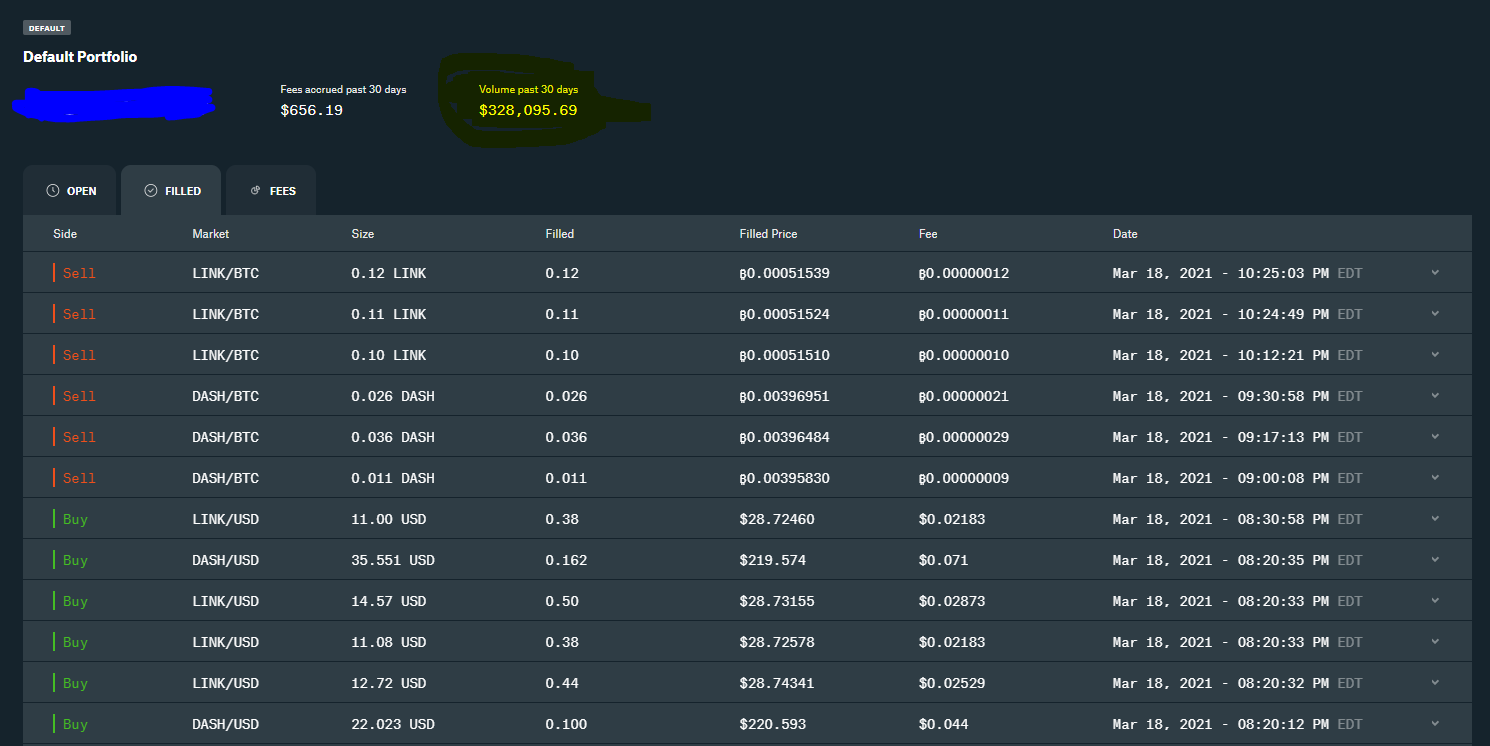
Performance report is available.
Hello and welcome to our most recently updated portfolio report, visually it is represented by the percent of Return on Investment.
Please note that the column named Quote 2 is for use of pulling the data that is closely related to the actual market places in USD, we understand the fact that USDT is another form of currency, and thus it does not truly reflect the current market prices per trading pair, but it is sufficiently close enough for the time being. (Market data is being pulled from Poloniex for convenience purposes only.

So we're up $5,000 USD from 30 days ago, let's compare that to what we had before and see if it matches exactly what we are seeing or if there is some type of discrepancy in our numbers.
Noted, so according to my notes this very closely correlates with what I had about 30-days ago, and how my total balance has been increased by this amount, but what kind of earnings am I generating vs simply getting lucky remains to be seen.

For the record, our software has traded over half a million dollars in a 30-day period but this is just to show the capabilities and how it's designed to adapt to uneven changes in the market.