## Calculating losses for this period.
Our performance report for the period of 10.9.2020 to 11.8.2020 shows a loss in most markets, this is due to the fact that the USD has been doing fairly weak against the BTC.

So today we'll look at the worse-performing pair -- that being ZRX-BTC, and find out why it seems to be doing so terribly.
## ZRX-BTC chart analysis

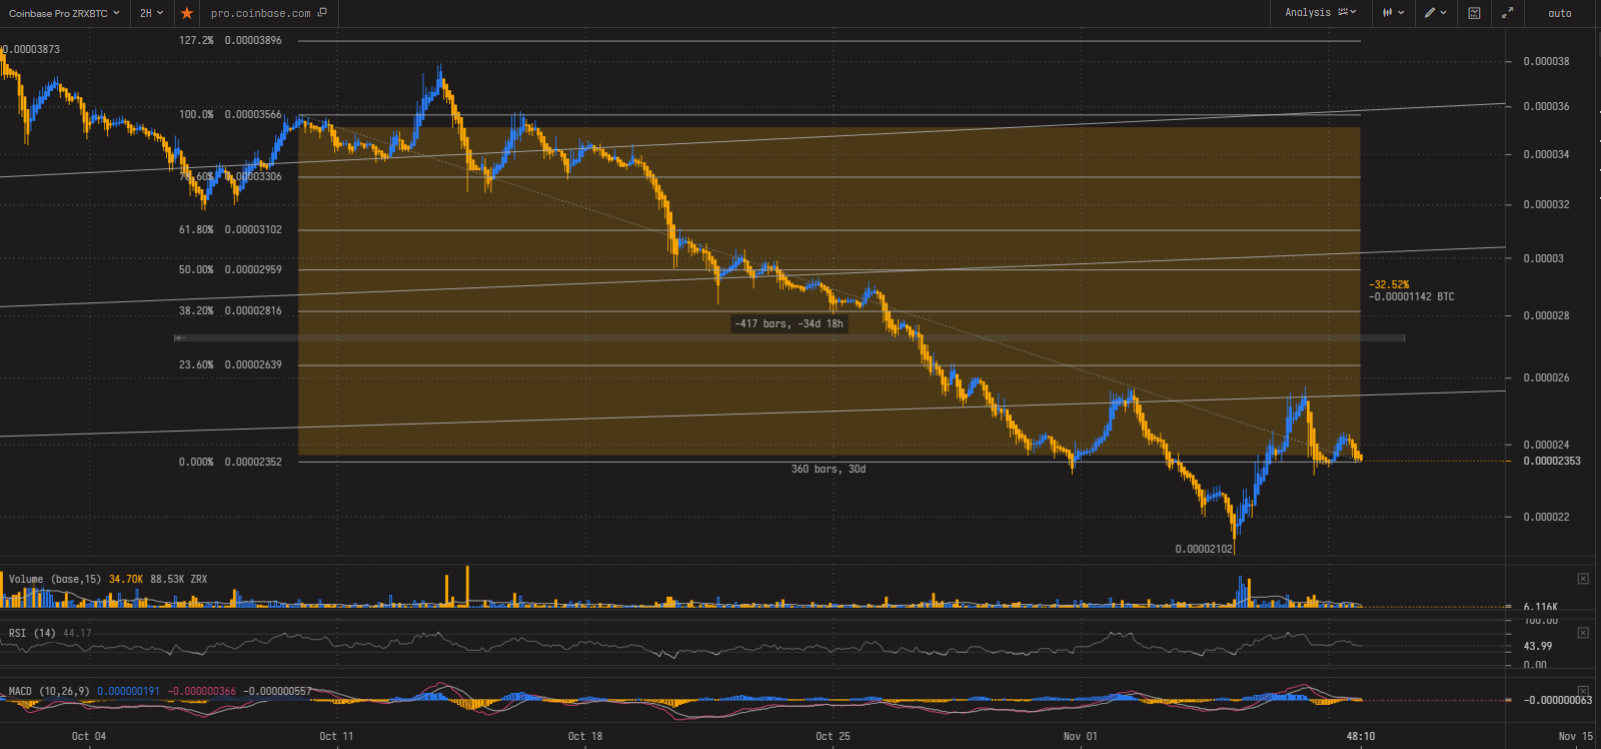
When checking the 30-day price change for this pair, we see that it has fallen 32% since this period began, the orange rectangle in the chart above gives us two pieces of information when selecting the start and end range. Firstly, it gives us the 30-day period window we are currently looking at (see bottom, center of large orange section), as well as the net percentage change for this time frame (see right of large orange section rectangle).
Great, so now that we are aware of the net change during this time-frame, let's find our current average per our excel sheet. It shows that we have purchased 5300 ZRX for a total sum of 0.146 BTC, this puts us at the approximate price of 2.75e-5, or 0.0000275. And this price is marked as a gray line from the bottom 30% of the orange rectangle. So far so good, given that BTC has been spent at an average price that is above the current price, this is represented as a loss -- as selling at the current market price would be the equivalent of buying high and selling low.
Feel free to comment below on my trading algorithm's strategy, if proven effective at minimizing losses we hope to confirm this in due time with a more detailed graph of the process, hopefully one that shows both price and position when stacked on a single graph.